





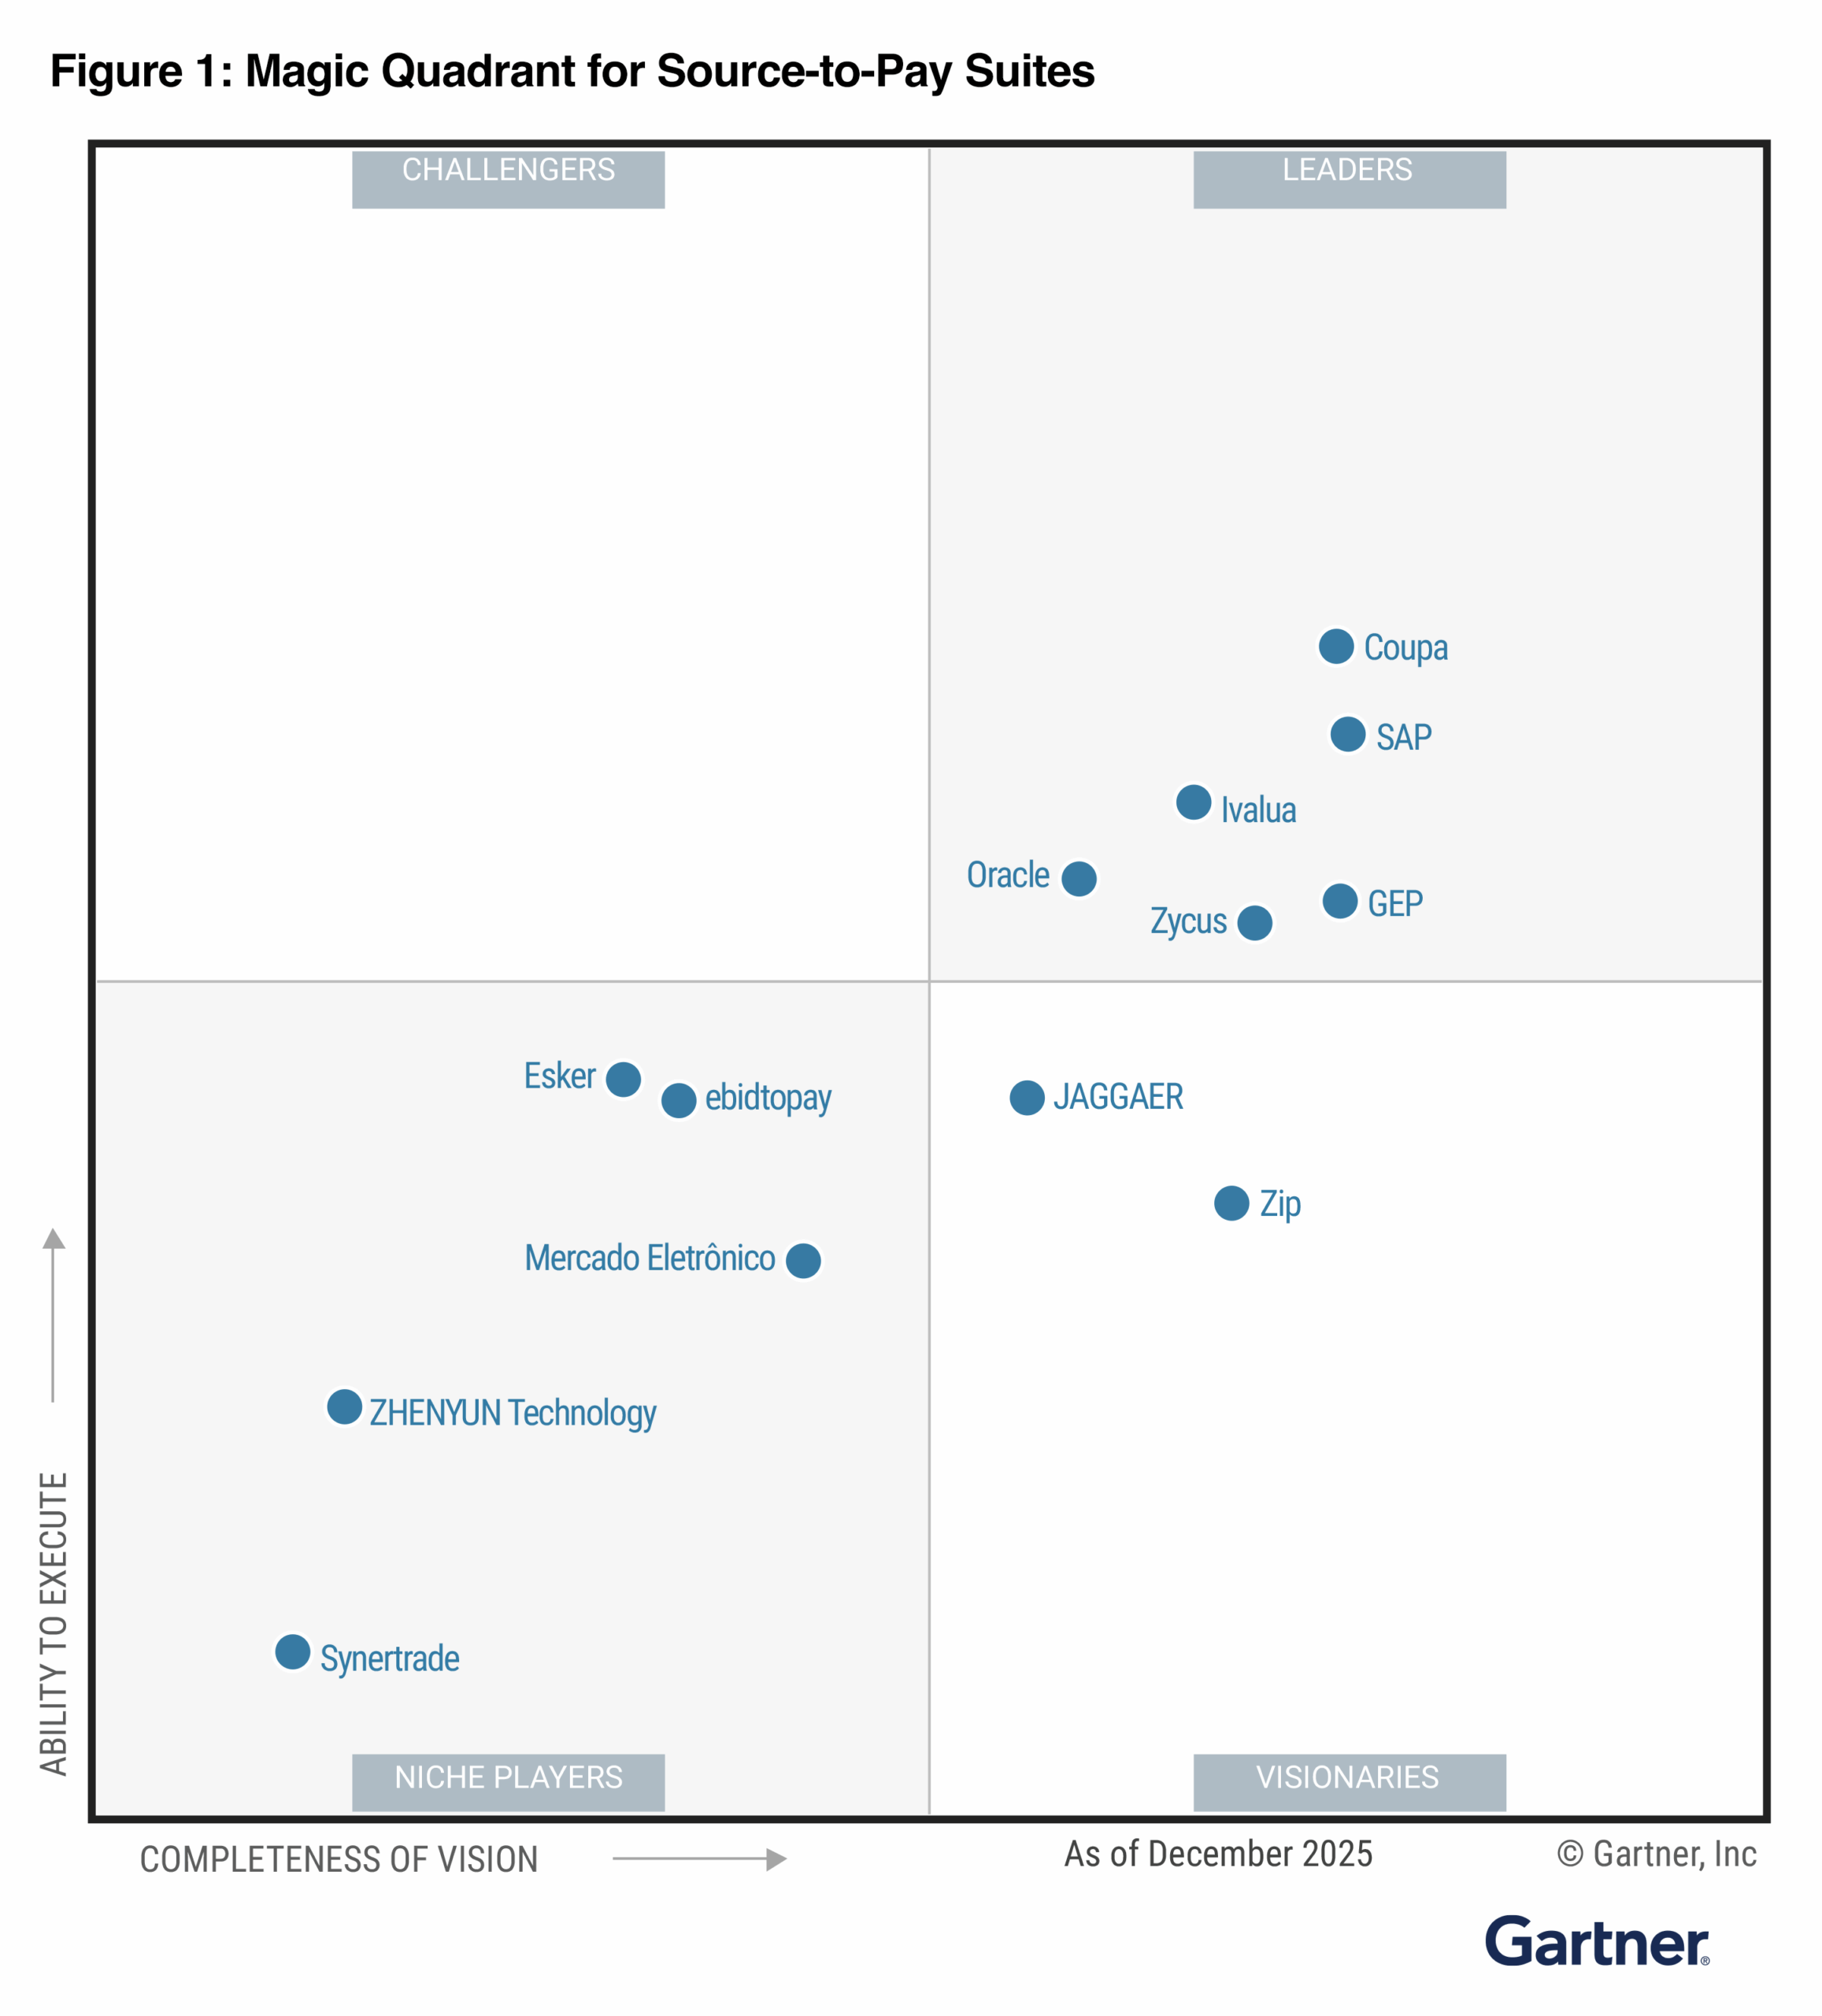



Health Zycus positioned in the “Leaders” Quadrant of the Gartner Magic Quadrant for Strategic Sourcing Application SuitesHealthcare organizations face relentless margin pressure, complex clinical supply chains, and strict regulatory demands. Measuring the true financial impact of modernizing sourcing in Healthcare Procurement requires looking beyond simple unit-price reductions.
By deploying AI-powered sourcing platforms like Zycus, health systems can automate RFP evaluations, optimize clinical preference items, and accurately calculate ROI across labor efficiency, risk mitigation, and contracted savings compliance. Delay in healthcare sourcing carries costs most business cases never capture. The number that survives a CFO conversation is the one you measured against your own baseline, not a vendor’s average.
TL;DR
- ROI from AI-powered sourcing in healthcare procurement comes from three measurable levers: compressed cycle time, benchmark-driven negotiation savings, and recovered strategic capacity.
- The calculation starts with your own baseline, not an industry average: time-to-award, cost-per-sourcing-event, and delay-to-deployment.
- APQC benchmarking shows the cost to process a single purchase order ranges from about $14 to more than $54, a gap driven by how procurement work is structured, not by industry or scale.
- Only 61% confidence exists that savings even reach the P&L, so a defensible number matters more than a large one.
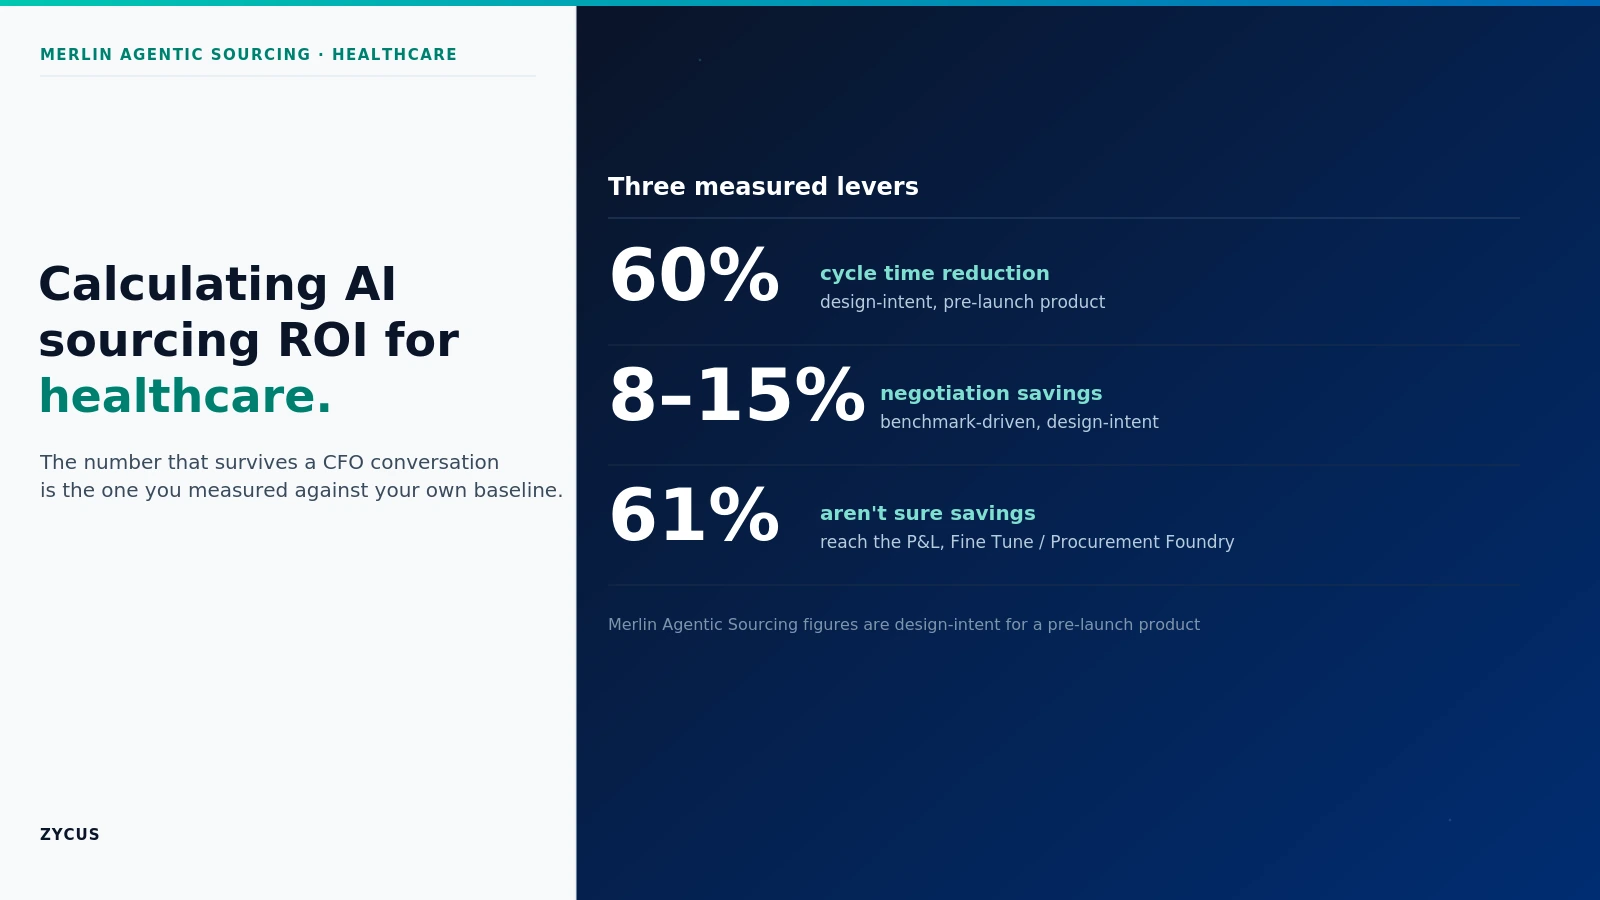
- Merlin Agentic Sourcing is designed to cut sourcing cycle time from strategy to award by up to 60% and add 8 to 15% in benchmark-driven negotiation savings.
AI-powered sourcing ROI in healthcare procurement comes from three measurable levers: compressed sourcing cycle time, benchmark-driven negotiation savings, and recovered strategic capacity. The calculation starts with your own baseline, not an industry average. Measure time-to-award, cost-per-sourcing-event, and delay-to-deployment for whatever you are sourcing, then model the change against those numbers. This guide is written for VP of Sourcing and Director of Procurement leaders at healthcare systems, hospital networks, and clinical provider organizations who need a business case a CFO will sign.
What does sourcing delay actually cost a healthcare system?
The obvious cost of a slow sourcing cycle is staff time. The larger cost is what waits behind it. When a health system takes four months to source and award a new infusion pump fleet, a nurse-call system, or an imaging service contract, the delay is not neutral. Equipment deployment slips. A planned system go-live moves a quarter. A contract renewal lapses into an unfavorable auto-renewal because the sourcing team could not run a competitive event in time.
These are operational and financial costs, not clinical claims, and they rarely appear in a procurement business case. Most cases count the hours saved on running an RFP and stop there. That is the number finance discounts first. The cost that matters is the cost of the gap between when the organization needed a decision and when procurement could produce one. A capital project that budgeted for equipment to be live in the third quarter, but sits idle into the fourth because the sourcing event ran long, has a carrying cost that finance can name precisely.
A service contract that lapsed into a higher auto-renewal rate has a premium that shows up on the next invoice. These are the costs a defensible case is built to recover, and they are invisible until someone measures the delay that produced them.
Read this to learn more about procurement in healthcare.
Checkout some of these best business cases for procurement:
- Building a Business Case for AP Process Automation
- Building the Business Case for Procurement Orchestration
- Making a Business Case for Procurement Automation
Why do most ROI numbers fail to survive a CFO conversation?
Because they are built on soft savings. Time saved, efficiency gained, and productivity improved all read as estimates a CFO can discount to zero. The problem is not that the savings are unreal. It is that they are unmeasured and unowned.
The gap is well documented. A 2021 Fine Tune and Procurement Foundry survey found that 61% of procurement teams do not believe, or do not know whether, they are adequately resourced to make savings actually reach the P&L. That is the credibility problem in one number. If most teams cannot connect their own savings to the income statement, a borrowed industry ROI figure will not survive the first question in the room. The number that survives is the one the team measured itself, against a baseline it can defend.
How do you baseline your current sourcing cost and cycle time?
Start with three measurements, taken from your own last twelve months of sourcing activity.
First, time-to-award: the median number of days from the moment a category is identified for sourcing to the moment a supplier is awarded. Second, cost-per-sourcing-event: the fully loaded internal cost of running one event, staff hours plus any external support. Third, delay-to-deployment: the lag between award and the point where the sourced goods or services are operational.
An external anchor helps calibrate the second number. APQC benchmarking data shows that organizations spend anywhere from about $14 to more than $54 to process a single purchase order. That is a range of more than three to one for the same routine transaction, and APQC attributes the spread not to industry or scale but to how the procurement work is structured, standardized, and governed. These figures are for purchase-order processing, not full strategic sourcing events, so use them to calibrate rather than to substitute for your own measurement: they tell you the range between an efficient and an inefficient operation is wide and driven by process design, which is precisely what a sourcing tool changes. Your own fully loaded event cost places you somewhere in that spread, and that measured number, not the benchmark, is what enters the model.
Read More About Zycus positioned in the “Leaders” Quadrant of the Gartner Magic Quadrant for Strategic Sourcing Application Suites
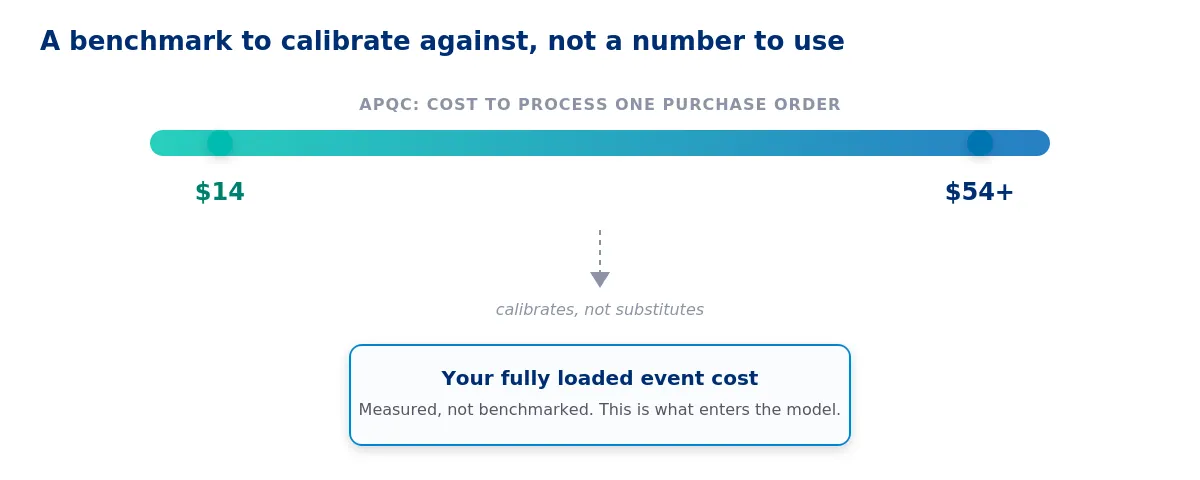
Figure 1. The APQC range calibrates where your operation sits. Your own measured event cost, not the benchmark, is what enters the model.
Where does AI-powered sourcing change those numbers?
Once the baseline exists, the model becomes a comparison rather than a claim. AI-powered sourcing changes each of the three measured numbers through a specific mechanism.
An agentic sourcing tool like in this case “Merlin Agentic Sourcing” runs a strategic sourcing category from problem statement to award across two connected phases. A strategy phase builds the category analysis, should-cost model, and qualified supplier shortlist. An execution phase authors the event, validates compliance, manages supplier communication, and models award scenarios. Because both phases run on one data layer, the execution phase does not rebuild what the strategy phase already produced, and that is where time-to-award compresses. How much it compresses, and how much it adds through benchmark-driven negotiation, is what the next section puts into the model, applied to the addressable spend that runs through competitive events rather than to total spend.
What ROI can healthcare procurement teams reasonably model?
The model is baseline times lever, summed across the three areas. It is worth grounding it in where the market actually sits. Ardent Partners, in its AI Rising 2026 research surveying 311 CPOs and senior procurement leaders, found that 58% of the procurement market is now actively using or piloting AI. Adoption is no longer the differentiator. Disciplined measurement of return is.
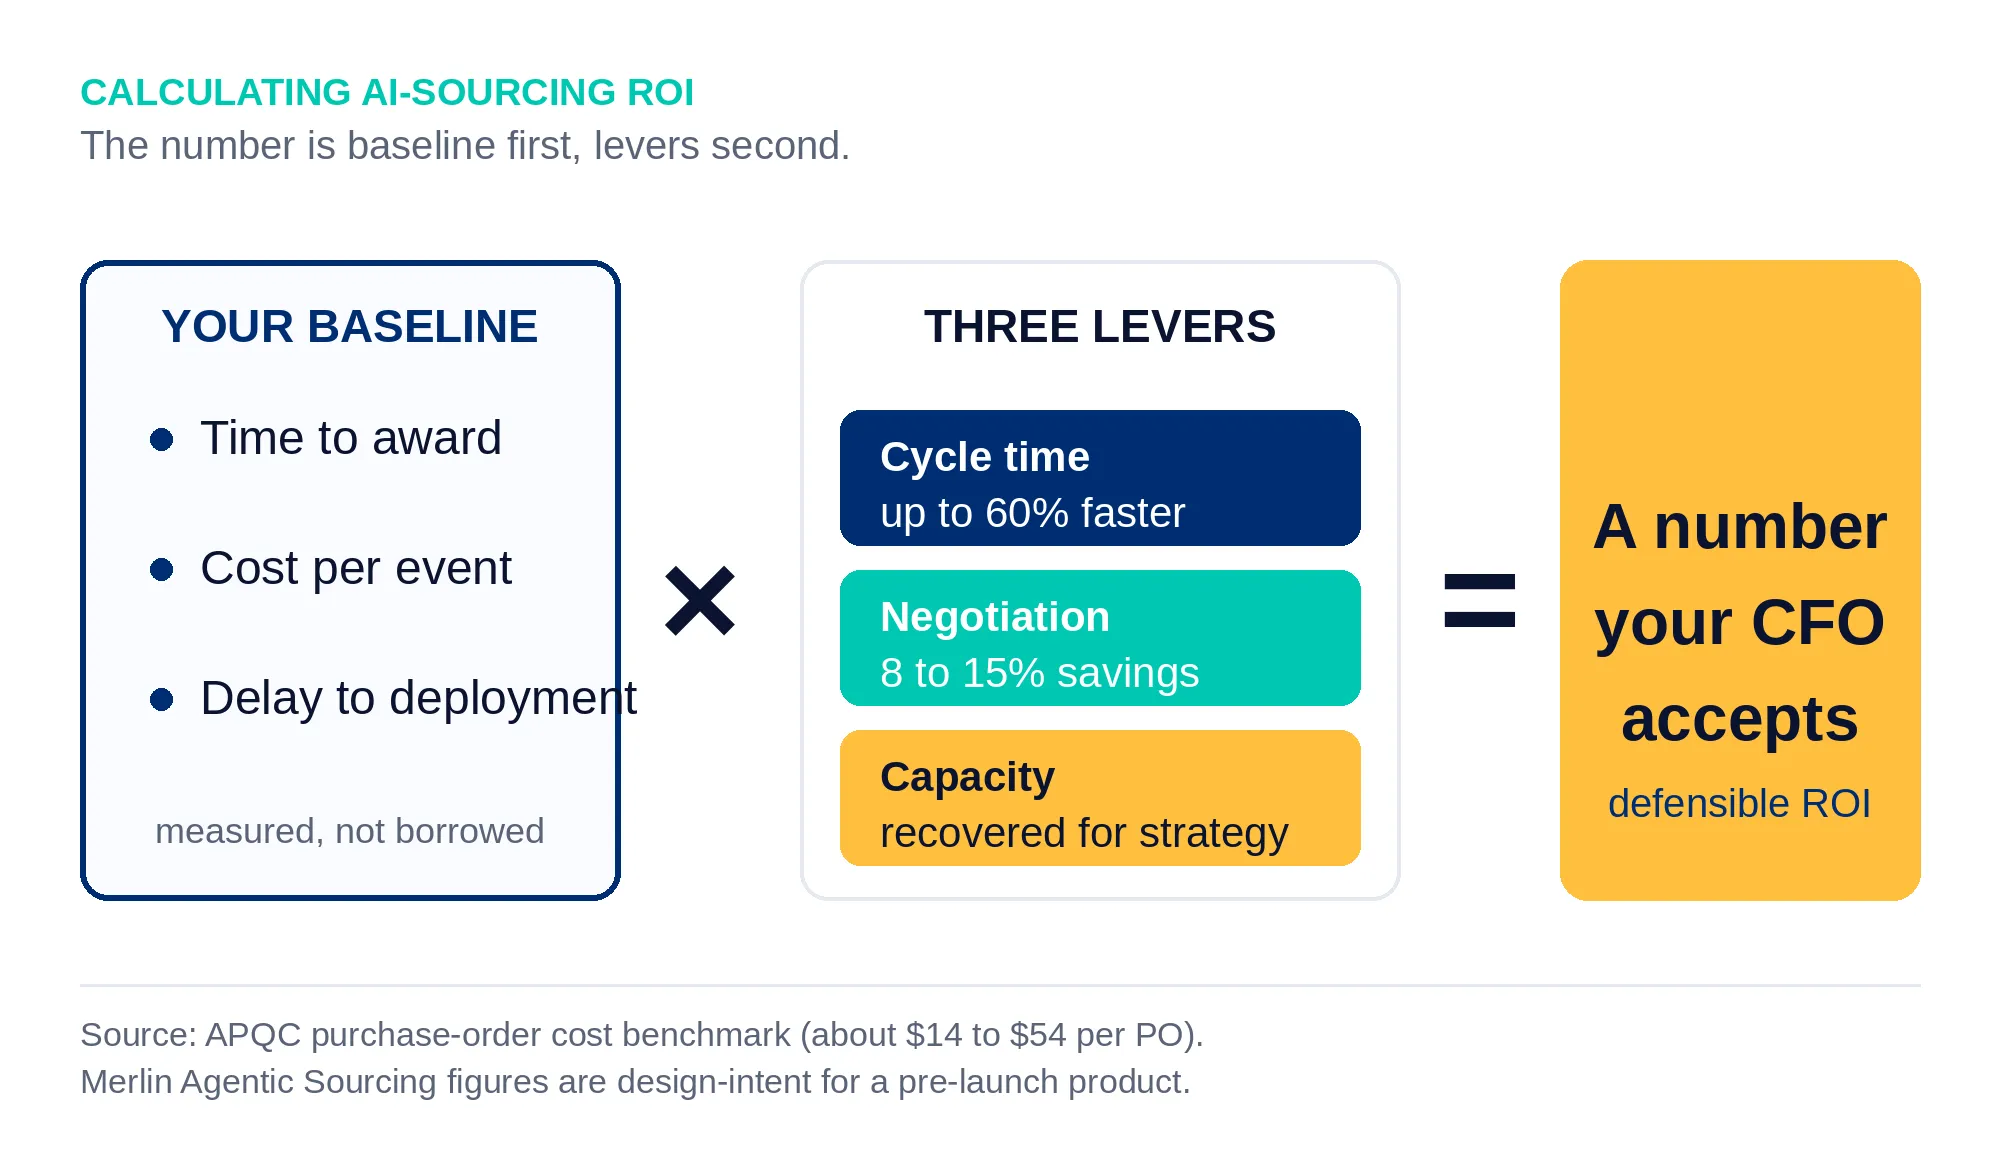
Figure 2. AI-sourcing ROI is your measured baseline multiplied by three named levers, not a borrowed industry number.
Merlin Agentic Sourcing is designed to cut sourcing cycle time from strategy to award by up to 60% and to add 8 to 15% in additional savings through benchmark-driven negotiation. Those are design-intent figures from a pre-launch product, not a healthcare customer benchmark, so they enter the model as the change lever applied to your baseline, not as a promised result. Take a health system running 40 strategic sourcing events a year, each currently taking a median 90 days and costing a fully loaded $30,000 to run. A 60% cycle-time reduction is not primarily a cost saving.
It is capacity: the same team can run more events, or redirect the recovered weeks to higher-value categories that were previously left unsourced. On the savings side, apply the 8 to 15% benchmark-driven negotiation lever only to the addressable spend that actually runs through competitive events, not to total spend, and only where a benchmark exists to negotiate against. Layer in the avoided cost of lapsed renewals and delayed deployments captured in the first baseline measure. The result is a number built entirely from the organization’s own figures, with each external and product lever named and sourced. That is what makes it defensible.
Which of these savings will your CFO actually accept as hard numbers?
Not all three levers carry equal weight in a finance conversation. Negotiation savings on competitively sourced spend are the closest to hard: they show up as a lower contracted price against a documented baseline price. Avoided costs from lapsed renewals are defensible when the auto-renewal premium is documented. Capacity recovered from cycle-time compression is real but soft, it converts to value only if the freed capacity is redeployed to categories that produce measurable savings, so present it as enabled capacity with a named use, not as a dollar figure on its own. Separating the three this way, before the CFO does it for you, is what earns the case its credibility.
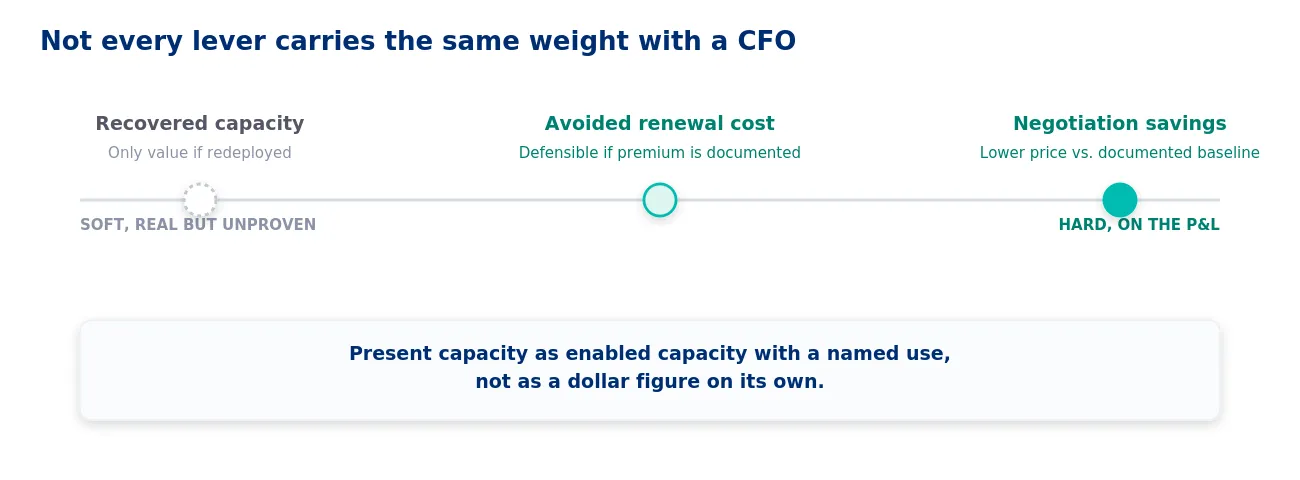
Figure 3. The three levers are not equally hard. Present each for what a CFO will actually credit it as.
What should you bring into the CFO conversation?
Bring your baseline first: the three measured numbers, with their methodology. Bring the levers second, each one named and sourced, with the product figures labeled as design-intent rather than guaranteed. Bring the hard-versus-soft split third, so the CFO sees you have already discounted the soft savings yourself. A business case that shows its work, and shows its own skepticism, is the one that gets funded. The vendor’s headline ROI number is where most cases start. Your own baseline is where the credible ones do.
Calculating ROI on AI-driven platforms proves that transforming sourcing in healthcare procurement is far more than an operational expense, it is a direct protector of operating margins. By quantifying hard-dollar contract savings, improved compliance, and hours reclaimed through automation, supply chain leaders can build an undeniable business case for AI adoption.
Leading organizations across the medical spectrum are already proving the financial viability of these technologies. From massive hospital networks like UPMC optimizing their clinical supply chains, and major healthcare leaders like Netcare, the shift toward AI-powered sourcing is becoming the industry standard. By analyzing the proven success of these top-tier healthcare and pharmaceutical enterprises, supply chain leaders can build a highly accurate, data-backed ROI model for their own digital transformation.
Download the Health Alliance Plan using AI Procurement Case Study
Ready to unlock hidden savings and optimize value across your clinical and non-clinical spend? Request a demo today to see how Zycus’s AI-driven procurement solutions turn healthcare sourcing into a resilient, high-ROI operational advantage.
Frequently Asked Questions
Q1. How do you calculate ROI on AI-powered sourcing software?
Add the value of three measured levers, negotiation savings on competitively sourced spend, avoided costs from faster cycles, and redeployed capacity, then divide by the software and implementation cost. The critical step is measuring each lever against your own current-state baseline rather than applying a vendor’s average, because a number you measured is the one that survives a CFO’s questions.
Q2. What is a realistic payback period for AI sourcing and RFP automation?
Payback depends on sourcing volume and addressable spend, not a fixed timeline. A team running many competitive events per year on a large base of addressable spend reaches payback faster, because the negotiation-savings lever applies to more transactions. Model payback from your own event count and spend under management, not from a published benchmark figure.
Q3. What should a healthcare system baseline before building an ROI case?
Three numbers from the last twelve months: median time-to-award, fully loaded cost-per-sourcing-event, and delay-to-deployment between award and operational use. These three establish the current-state the ROI model measures change against. Without them, any ROI figure is a borrowed average rather than a defensible projection.
Q4. What is the difference between hard and soft savings in procurement ROI?
Hard savings show up on the P&L as a lower price against a documented baseline, negotiated price reductions are the clearest example. Soft savings, such as recovered staff time, are real but convert to value only if the freed capacity is redeployed to measurable work. CFOs discount soft savings heavily, so a credible case separates the two and quantifies only the hard.
Q5. How much can AI-powered sourcing reduce RFP cycle time?
It depends on how much of the delay comes from rework between strategy and execution phases. Merlin Agentic Sourcing is designed to cut cycle time from strategy to award by up to 60%, partly because its execution phase does not rebuild the analysis its strategy phase already produced. That figure is design-intent for a pre-launch product and should be modeled against your measured baseline.
Q6. Does AI sourcing ROI differ for healthcare versus other industries?
The calculation method is the same, but the cost of delay is often higher in healthcare, because sourcing delay can push equipment deployment and system go-lives, not only staff hours. The addressable-spend and negotiation levers work identically. The delay-to-deployment measure is where healthcare-specific stakes enter the model.
Q7. What is a typical cost-per-sourcing-event benchmark?
Full strategic sourcing events are not benchmarked as cleanly as purchase orders, but APQC data on PO processing shows a range of about $14 to more than $54 per order, driven by how the work is structured. Use it to calibrate the relative efficiency of your operation, then measure your own fully loaded event cost directly for the ROI model.
Q8. How does Merlin Agentic Sourcing measure and report ROI?
Merlin Agentic Sourcing runs strategic categories from problem statement to award on a single data layer, which makes cycle time and event throughput directly measurable within the flow. It is designed to cut sourcing cycle time by up to 60% and add 8 to 15% in benchmark-driven negotiation savings. As a pre-launch product these are design-intent figures, so the reliable ROI number remains the one modeled against your own baseline.